Sunday, April 29, 2007
The myth of the closer
The MLB average ERA was around 4.50 in 2006, and the average team yielded an additional 10% unearned runs above their earned run total.
So a hypothetical average pitcher on an average team who has logged 50 innings will have yielded 28 runs, 25 of them earned.
Suppose this hypothetical average pitcher is the closer, who appears for 1 inning in each of 50 save situations (Note: The average team in 2006 had 60 save situations, several of which would have arisen when the regular closer wasn't available.)
The save situation by definition means a lead of 1-3 runs when the opponent comes up for its final at bat. A likely distribution of these leads would be: 28 - 1-run leads, 15 - 2-run leads and 7 - 3-run leads.
Suppose our Hypothetical Average Closer ("HAC") gives up his 28 runs by allowing exactly 1 run in 28 of his appearances. This is an unlikely distribution, since runs often come in bunches, but if these 1-run outings were evenly distributed, you see that the HAC closer would wind up with 34 saves. He'd blow 16 of the 28 1-run leads, but preserve all the 2- and 3- run leads. It's a lot of blown saves, and you wouldn't hold him in high regard as a closer. Note, however, that the MLB average rate of converted save opportunities is 66% and this HAC closer has converted 68% of his saves.
But his 28 runs would be more bunched up. Let's suppose a distribution of 2 outings with 3 runs allowed, 6 outings with 2 runs allowed and 10 outings with 1 run allowed. This means 32 outings with no runs allowed. That's 32 converted saves right off the bat. Suppose the other outings are distributed somewhat evenly (the asterisks signify blown saves):
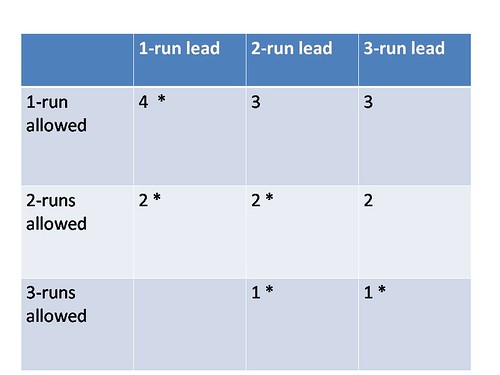
This plausibe situation involving an average pitcher with an ERA of 4.50 results in 40 saves out of 50 opportunities. 40 saves is enough to get a pticher rated as a "premier closer" and the 80% save conversion rate is above the league average. Our HAC closer also has an 0-3 won-loss record, but losing records for closers are quite unremarkable and considered par for the course. (Trevor Hoffman, last year's top NL reliever was 0-2, and 30% of the winners of the Rolaids Relief Man Award in the past 20 years have had losing records.)
Under this very straightforward reasoning (that an average pitcher gives up around 1 run every two innings, and runs are allowed in bunches, not entirely in ones) we can figure that an average pitcher should save significantly more than half of his 1-run save opportunities.
What does all this mean? Not that the closing role is unimportant and can or should always effectively be filled by average pitchers. But it supports two radical theories (neither mine):
1) Bill James's argument that many save situations (e.g., 2 or 3 run leads, or 1 run leads with the bottom of the order coming up) don't call for your best relief pitcher;
2) Billy Beane's theory that you can take an average pitcher, pump up his stats so that he looks like a "premier closer" who is thereafter totally overvalued in the trade market, and trade him for some real (undervalued) talent. (See the career stats of former Oakland A's "closer" Billy Taylor for an illustration.)
In other words, most of the pitchers who you think are first-rate closers are not really that good. And most teams probably have 2-3 guys in the bullpen, other than the designated closer, who could serve equally well in the closing role -- they just don't get the opportunity to put together closing stats. This being true, the closing role could, and probably should, return to what it was before the early 1980s -- just another relief situation where a manager could plug in the guy who seems right for the job in that situation on that day.
So a hypothetical average pitcher on an average team who has logged 50 innings will have yielded 28 runs, 25 of them earned.
Suppose this hypothetical average pitcher is the closer, who appears for 1 inning in each of 50 save situations (Note: The average team in 2006 had 60 save situations, several of which would have arisen when the regular closer wasn't available.)
The save situation by definition means a lead of 1-3 runs when the opponent comes up for its final at bat. A likely distribution of these leads would be: 28 - 1-run leads, 15 - 2-run leads and 7 - 3-run leads.
Suppose our Hypothetical Average Closer ("HAC") gives up his 28 runs by allowing exactly 1 run in 28 of his appearances. This is an unlikely distribution, since runs often come in bunches, but if these 1-run outings were evenly distributed, you see that the HAC closer would wind up with 34 saves. He'd blow 16 of the 28 1-run leads, but preserve all the 2- and 3- run leads. It's a lot of blown saves, and you wouldn't hold him in high regard as a closer. Note, however, that the MLB average rate of converted save opportunities is 66% and this HAC closer has converted 68% of his saves.
But his 28 runs would be more bunched up. Let's suppose a distribution of 2 outings with 3 runs allowed, 6 outings with 2 runs allowed and 10 outings with 1 run allowed. This means 32 outings with no runs allowed. That's 32 converted saves right off the bat. Suppose the other outings are distributed somewhat evenly (the asterisks signify blown saves):
This plausibe situation involving an average pitcher with an ERA of 4.50 results in 40 saves out of 50 opportunities. 40 saves is enough to get a pticher rated as a "premier closer" and the 80% save conversion rate is above the league average. Our HAC closer also has an 0-3 won-loss record, but losing records for closers are quite unremarkable and considered par for the course. (Trevor Hoffman, last year's top NL reliever was 0-2, and 30% of the winners of the Rolaids Relief Man Award in the past 20 years have had losing records.)
Under this very straightforward reasoning (that an average pitcher gives up around 1 run every two innings, and runs are allowed in bunches, not entirely in ones) we can figure that an average pitcher should save significantly more than half of his 1-run save opportunities.
What does all this mean? Not that the closing role is unimportant and can or should always effectively be filled by average pitchers. But it supports two radical theories (neither mine):
1) Bill James's argument that many save situations (e.g., 2 or 3 run leads, or 1 run leads with the bottom of the order coming up) don't call for your best relief pitcher;
2) Billy Beane's theory that you can take an average pitcher, pump up his stats so that he looks like a "premier closer" who is thereafter totally overvalued in the trade market, and trade him for some real (undervalued) talent. (See the career stats of former Oakland A's "closer" Billy Taylor for an illustration.)
In other words, most of the pitchers who you think are first-rate closers are not really that good. And most teams probably have 2-3 guys in the bullpen, other than the designated closer, who could serve equally well in the closing role -- they just don't get the opportunity to put together closing stats. This being true, the closing role could, and probably should, return to what it was before the early 1980s -- just another relief situation where a manager could plug in the guy who seems right for the job in that situation on that day.
Comments:
<< Home
Even pre-Money Ball, Billy Bean had a reputation for the "Pump and Dump" scheme. Bean's thought process is that "a closer" should be judged by other skill sets, not necesarily the accumulation of saves. Among those skil sets is command, which is measured in part by K/BB ratio.
His approach is an interesting study in economics as he took imperfect information, and in turn, turned that to his advantage.
His approach is an interesting study in economics as he took imperfect information, and in turn, turned that to his advantage.

On another note, Ron Shandler's site Baseball HQ, defines closer level stuff by the following three metrics. A K/9 of at least 5.6, a 2.0/1 strikeout to walk ratio, and a HR/9 of less than one. In addition to running Baseball HQ, Shandler was also a consultant to the Cards for a couple of years.
Post a Comment
Subscribe to Post Comments [Atom]
<< Home
![]()
Subscribe to Posts [Atom]