Saturday, August 05, 2006
The Whale Curve -- a baseball insight
The Mets just "locked up" Jose Reyes for the next few years, signing him to a 4-year deal -- at a bargain price of $6 million a year -- with an option for a fifth. So he's locked up through age 28. They should do the same thing with David Wright -- particularly with David Wright -- and should consider "locking him up" through age 31 or 32, and then trading him.
There’s a pattern in the careers of major league hitters that seems to hold true in a remarkable number of instances. It doesn’t describe the career of every major league hitter, but it probably describes the careers of the majority of position players good enough to play for more than 10 full major league seasons. (It doesn't, as far as I can tell, apply to pitchers.)
I call it “the Whale Curve.”
Essentially, if you graph a major league hitter’s year-by-year offensive production on the vertical axis and his age on the horizontal axis, you get a curve that resembles the outline of a whale.
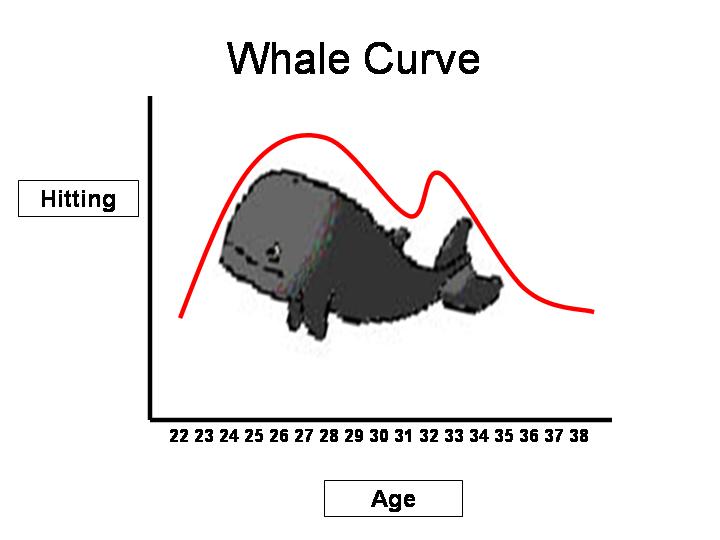
This reflects the following apparent facts: most major league hitters have their "career year" -- their best season -- at around age 27 or 28. (This is the top of the whale's head.) They then experience 2-3 seasons of decline from that peak, followed by a second, usually slightly lower peak (the whale’s tail), at around age 31 or 32. After that, age causes a general and more pronounced and permanent decline.
If you were to examine the career statistics of 20 randomly selected players with 10 or more years of major league experience, I bet you would find the Whale Curve in at least 12 (60%) of them.
I did a very unsystematic survey of 30 ballplayers and found the pattern in about 16-18 instances. It's hard to be precise, because identifying and ranking a player's 2-3 best offensive seasons can require some arguable judgment calls. In many cases, I just reviewed career stats (handily correlated by age at Baseballreference.com) and impressionistically picked out the best years.
A neater way to undertake the analysis would be to use Bill James's "win shares," in which he reduces the impact of a players entire package of offensive statistics to a single integer. This makes comparisons of a players' seasons quite easy, but since I don't have the Win Shares book, I was forced to rely on the non-random selection of players whose Win Shares data James chose to present in the appendix to his revised Historical Baseball Abstract.
Here are some results:
Fitting the pattern very closely, with the best season at 27 or 28 and the second best season 3-4 years later, at 31 or 32, are: Dave Winfield, Barry Larkin, Lenny Dykstra, Jeff Bagwell, Manny Ramirez, Mike Piazza, Carlos Delgado, and Frank Thomas. Dave Parker and Ken Griffey, Jr. both had career years at 27 or 28 and then had their "whale tail" (their later career spike) at 34-35 -- though, notably, both had seriously limited playing between ages 30 and 33 due to injuries.
There are minor variants that are still fundamentally captured by this curve. A handful of players fit the pattern, except with the head and tail reversed -- that is, the second career spike was slightly better than the earlier one: Gary Carter, Ricky Henderson, George Brett. Jeff Bagwell put two "whale tail" peak seasons together at age 31-32. Sometimes the "whale tail" is the 3rd best of the player's career, with the second best coming one year before or after the first"career" season.
And the whale shape is a very rough approximation. Some players' peaks will be less pronounced -- less different from their down years. And career trajectory curves are not always so rounded -- Lenny Dykstra's peak years form a curve looking more like a suspension bridge than a whale -- but you have to admit the pattern is remarkably counterintuitive. You probably expected that career trajectories would either have no discernable pattern at all, or else would look more like a bell curve, with the top being at somewhere around 28 or 29. But it doesn't work that way in most cases.
If I'm right about this, why is there a Whale Curve? My theory is that hitting performance is the result of a relationship between two curves: raw physical skill and major league experience and savvy. Many baseball experts have noted that major league hitters reach their physical peak at around age 28. My theory is that after hitting that peak, most players' physical skills drop off markedly, causing the decline (and forming the whale-head shape of the curve).
What causes the tail -- the second performance peak -- is the rise of baseball experience and savvy, that allows hitters to put together a second "career year" before their physical skills deteriorate to the point that savvy can no longer compensate. The dip between head and tail is the result either of insufficient baseball savvy, or unpreparedness or unwillingness to recognize one's declining physical skills and the need to compensate for them with strategems.
Is this "Whale Curve" idea original? I don't know. Certainly, the notion of a "career year" is commonplace, as is the idea of a performance peak at around age 28. What I've never heard before is any systematic observation of, let alone explanation for, the whale tail -- the second, lesser peak. That tends to get treated either as consisency or else a kind of comeback miracle. Anyway, let me know if you've heard this notion before.
Last season, the Mets' Cliff Floyd was having a renaissance year after several years of injury and decling performance following his "career year" -- at age 28. When the Mets were clearly out of it in July, I had argued to friends that now would be the time to trade him. He was 32 and enjoying his second career peak season -- a classic Whale Curve career trajectory. His trade value, I argued, would never be higher. They kept him. I don't mind, because I think he's a great "clubhouse influence" and still has some pop in his bat. But his offensive production has dropped off markedly -- and predictably -- this season.
You can see how this might be useful to general managers (and fantasy league managers). Whether you use the Whale Curve to guide your trading strategy or not, it can help for planning purposes. You would have been ill advised to pencil in Cliff Floyd for more than 24 home runs this season (compared to last year's 32). Carlos Delgado peaked at 28 and 31, but then had a surprising comeback last year at 33. While a two-peaked tail doesn't fit my model, you'd nevertheless be crazy not to expect a significant dropoff in production from Delgado at 34. Delgado, by the way, has been in a two month seeming slump since mid June. I'd love to be wrong about this and see him finish up strong, but I'm afraid it's not a slump -- he's a streak hitter who's just getting old.*
What about all the players -- the 40% or so -- that don't fit the pattern? Don't they significantly diminish the usefulness of the "Whale Curve"? To be sure, there are some outliers that I just can't explain, who find baseball inspiration in their 30s and recreate themselves -- Paul Molitor, Tony Gwynn, Craig Biggio. Derek Jeter is the poster boy for "outlier." And there are surprising flameouts, like Will Clark, who peaked at 25 and 27 and was washed up by 31 without ever peaking again.
But most of the exceptions to the whale curve seem themselves to fall into patterns that can be explained consistently with the whale curve ideas.
1. Bulking up. Players who have their best seasons at age 33 or later, after several years as full time major leaguers, have probably undertaken a major campaign to bulk up their bodies. Interestingly, both Barry Bonds and Rafael Palmiero had "Whale Curve" career trajectories -- best season at 28, second best season at 31, followed by a marked decline. Both "miraculously" broke out of this pattern in their mid-late 30s, Palmiero at 34 and Bonds at 35. Bulking up with supplements, whether illegal steroids or legal stuff, is undertaken precisely to offset the body's natural decline and probably always (certainly in the case of steroids) comes at the price of long term health consequences. I think the a player whose career path breaks the Whale Curve pattern in this way -- having a resurgence of home-run power after age 33 -- has gone on some bulk-up regimen. Makes you wonder what Jim Thome is up to. Players like Jason Giambi or Jose Canseco, who bulked up on steroids from the outset of their careers, were never going to have Whale Curve trajectories. Canseco flamed out; Giambi is up and down.
2. Age at promotion to the majors. The Whale Curve is more likely to be descriptive of players who became major league regulars between 21-24. Players who break into the majors after 24 will be relative newcomers when they hit their physical peak, thereby throwing off the phyisical prime-plus-playing experience algorithm that produces the Whale Curve. Players who become major league regulars before age 21 -- A-Rod, or Andruw Jones, for example -- also throw off the algorithm. They become seasoned veterans at around the same time they hit their physical peak. There's a tendency in these cases to have three peaks, like Willie Mays, one of them at 23-24 -- maybe there's some significance to three years of MLB experience -- or perhaps more of a bell curve career path.
3. Exogenous factors. Physical age and experience seem to be huge determinants of a player's relative year-to-year performance. But there are other factors external to these physical or mental abilities that can dominate. Injuries are the most obvious example. Harder-to-detect factors that would disrupt the Whale Curve are external changes to the hitting environment -- for example, a move from a hitters to a pitchers home ballpark (e.g., Hank Aaron), a significant change in the strike zone, introduce a lively ball, lowering the pitchers' mound, etc. Or pure playing time can throw off the curve: a player used as a sub or platoon player until age 30 who then finds himself playing every day may have his first peak year in his 30s.
Getting back to Reyes and Wright. Reyes, who became a major league regular at 20, is less likely that average to have a Whale Curve career path. But Wright, who's slightly older and started later, was pushing 22 when he became a regular. Look for him to peak at 28 (wow!!) and again at 31 or 32. And manage his contract accordingly.
_____
The season is exactly 2/3 over today, and Carlos has 26 homers and 73 RBIs. Projecting that performance out proportionally through the final third of the season, you might expect him to finish with 39 homers and 109 RBIs. Belive me, I wish that would happen. But I'm expecting he'll put up another 6-7 homers and will not break 100 RBIs.
There’s a pattern in the careers of major league hitters that seems to hold true in a remarkable number of instances. It doesn’t describe the career of every major league hitter, but it probably describes the careers of the majority of position players good enough to play for more than 10 full major league seasons. (It doesn't, as far as I can tell, apply to pitchers.)
I call it “the Whale Curve.”
Essentially, if you graph a major league hitter’s year-by-year offensive production on the vertical axis and his age on the horizontal axis, you get a curve that resembles the outline of a whale.
This reflects the following apparent facts: most major league hitters have their "career year" -- their best season -- at around age 27 or 28. (This is the top of the whale's head.) They then experience 2-3 seasons of decline from that peak, followed by a second, usually slightly lower peak (the whale’s tail), at around age 31 or 32. After that, age causes a general and more pronounced and permanent decline.
If you were to examine the career statistics of 20 randomly selected players with 10 or more years of major league experience, I bet you would find the Whale Curve in at least 12 (60%) of them.
I did a very unsystematic survey of 30 ballplayers and found the pattern in about 16-18 instances. It's hard to be precise, because identifying and ranking a player's 2-3 best offensive seasons can require some arguable judgment calls. In many cases, I just reviewed career stats (handily correlated by age at Baseballreference.com) and impressionistically picked out the best years.
A neater way to undertake the analysis would be to use Bill James's "win shares," in which he reduces the impact of a players entire package of offensive statistics to a single integer. This makes comparisons of a players' seasons quite easy, but since I don't have the Win Shares book, I was forced to rely on the non-random selection of players whose Win Shares data James chose to present in the appendix to his revised Historical Baseball Abstract.
Here are some results:
Fitting the pattern very closely, with the best season at 27 or 28 and the second best season 3-4 years later, at 31 or 32, are: Dave Winfield, Barry Larkin, Lenny Dykstra, Jeff Bagwell, Manny Ramirez, Mike Piazza, Carlos Delgado, and Frank Thomas. Dave Parker and Ken Griffey, Jr. both had career years at 27 or 28 and then had their "whale tail" (their later career spike) at 34-35 -- though, notably, both had seriously limited playing between ages 30 and 33 due to injuries.
There are minor variants that are still fundamentally captured by this curve. A handful of players fit the pattern, except with the head and tail reversed -- that is, the second career spike was slightly better than the earlier one: Gary Carter, Ricky Henderson, George Brett. Jeff Bagwell put two "whale tail" peak seasons together at age 31-32. Sometimes the "whale tail" is the 3rd best of the player's career, with the second best coming one year before or after the first"career" season.
And the whale shape is a very rough approximation. Some players' peaks will be less pronounced -- less different from their down years. And career trajectory curves are not always so rounded -- Lenny Dykstra's peak years form a curve looking more like a suspension bridge than a whale -- but you have to admit the pattern is remarkably counterintuitive. You probably expected that career trajectories would either have no discernable pattern at all, or else would look more like a bell curve, with the top being at somewhere around 28 or 29. But it doesn't work that way in most cases.
If I'm right about this, why is there a Whale Curve? My theory is that hitting performance is the result of a relationship between two curves: raw physical skill and major league experience and savvy. Many baseball experts have noted that major league hitters reach their physical peak at around age 28. My theory is that after hitting that peak, most players' physical skills drop off markedly, causing the decline (and forming the whale-head shape of the curve).
What causes the tail -- the second performance peak -- is the rise of baseball experience and savvy, that allows hitters to put together a second "career year" before their physical skills deteriorate to the point that savvy can no longer compensate. The dip between head and tail is the result either of insufficient baseball savvy, or unpreparedness or unwillingness to recognize one's declining physical skills and the need to compensate for them with strategems.
Is this "Whale Curve" idea original? I don't know. Certainly, the notion of a "career year" is commonplace, as is the idea of a performance peak at around age 28. What I've never heard before is any systematic observation of, let alone explanation for, the whale tail -- the second, lesser peak. That tends to get treated either as consisency or else a kind of comeback miracle. Anyway, let me know if you've heard this notion before.
Last season, the Mets' Cliff Floyd was having a renaissance year after several years of injury and decling performance following his "career year" -- at age 28. When the Mets were clearly out of it in July, I had argued to friends that now would be the time to trade him. He was 32 and enjoying his second career peak season -- a classic Whale Curve career trajectory. His trade value, I argued, would never be higher. They kept him. I don't mind, because I think he's a great "clubhouse influence" and still has some pop in his bat. But his offensive production has dropped off markedly -- and predictably -- this season.
You can see how this might be useful to general managers (and fantasy league managers). Whether you use the Whale Curve to guide your trading strategy or not, it can help for planning purposes. You would have been ill advised to pencil in Cliff Floyd for more than 24 home runs this season (compared to last year's 32). Carlos Delgado peaked at 28 and 31, but then had a surprising comeback last year at 33. While a two-peaked tail doesn't fit my model, you'd nevertheless be crazy not to expect a significant dropoff in production from Delgado at 34. Delgado, by the way, has been in a two month seeming slump since mid June. I'd love to be wrong about this and see him finish up strong, but I'm afraid it's not a slump -- he's a streak hitter who's just getting old.*
What about all the players -- the 40% or so -- that don't fit the pattern? Don't they significantly diminish the usefulness of the "Whale Curve"? To be sure, there are some outliers that I just can't explain, who find baseball inspiration in their 30s and recreate themselves -- Paul Molitor, Tony Gwynn, Craig Biggio. Derek Jeter is the poster boy for "outlier." And there are surprising flameouts, like Will Clark, who peaked at 25 and 27 and was washed up by 31 without ever peaking again.
But most of the exceptions to the whale curve seem themselves to fall into patterns that can be explained consistently with the whale curve ideas.
1. Bulking up. Players who have their best seasons at age 33 or later, after several years as full time major leaguers, have probably undertaken a major campaign to bulk up their bodies. Interestingly, both Barry Bonds and Rafael Palmiero had "Whale Curve" career trajectories -- best season at 28, second best season at 31, followed by a marked decline. Both "miraculously" broke out of this pattern in their mid-late 30s, Palmiero at 34 and Bonds at 35. Bulking up with supplements, whether illegal steroids or legal stuff, is undertaken precisely to offset the body's natural decline and probably always (certainly in the case of steroids) comes at the price of long term health consequences. I think the a player whose career path breaks the Whale Curve pattern in this way -- having a resurgence of home-run power after age 33 -- has gone on some bulk-up regimen. Makes you wonder what Jim Thome is up to. Players like Jason Giambi or Jose Canseco, who bulked up on steroids from the outset of their careers, were never going to have Whale Curve trajectories. Canseco flamed out; Giambi is up and down.
2. Age at promotion to the majors. The Whale Curve is more likely to be descriptive of players who became major league regulars between 21-24. Players who break into the majors after 24 will be relative newcomers when they hit their physical peak, thereby throwing off the phyisical prime-plus-playing experience algorithm that produces the Whale Curve. Players who become major league regulars before age 21 -- A-Rod, or Andruw Jones, for example -- also throw off the algorithm. They become seasoned veterans at around the same time they hit their physical peak. There's a tendency in these cases to have three peaks, like Willie Mays, one of them at 23-24 -- maybe there's some significance to three years of MLB experience -- or perhaps more of a bell curve career path.
3. Exogenous factors. Physical age and experience seem to be huge determinants of a player's relative year-to-year performance. But there are other factors external to these physical or mental abilities that can dominate. Injuries are the most obvious example. Harder-to-detect factors that would disrupt the Whale Curve are external changes to the hitting environment -- for example, a move from a hitters to a pitchers home ballpark (e.g., Hank Aaron), a significant change in the strike zone, introduce a lively ball, lowering the pitchers' mound, etc. Or pure playing time can throw off the curve: a player used as a sub or platoon player until age 30 who then finds himself playing every day may have his first peak year in his 30s.
Getting back to Reyes and Wright. Reyes, who became a major league regular at 20, is less likely that average to have a Whale Curve career path. But Wright, who's slightly older and started later, was pushing 22 when he became a regular. Look for him to peak at 28 (wow!!) and again at 31 or 32. And manage his contract accordingly.
_____
The season is exactly 2/3 over today, and Carlos has 26 homers and 73 RBIs. Projecting that performance out proportionally through the final third of the season, you might expect him to finish with 39 homers and 109 RBIs. Belive me, I wish that would happen. But I'm expecting he'll put up another 6-7 homers and will not break 100 RBIs.
![]()
Subscribe to Posts [Atom]